Transform your data into growth drivers
With a tailored approach, I help companies across various industries turn their data into growth drivers.
Whether you’re a startup, an SME, or a large enterprise, I help you maximize the value of your data for smarter strategic decisions and improved efficiency.
Tangible results, tailored to your reality
Explore real-world examplesTagline
What are the benefits of data and analytics for your industry ?
From retail to manufacturing, including SMEs and startups, discover how data boosts efficiency, responsiveness, and innovation across every sector.

Industry
Optimization of production processes, inventory management, cost reduction, and improvement of operational efficiency.

Local Authorities / Public Institutions
Improvement of administrative processes, modernization of public services, management of digital projects, cost streamlining.

Healthcare / Biotechnologies
Analysis of health data to improve care or products, management of research projects or the development of new products.

Hotel / Restaurant
Analysis of attendance trends, management of operational costs, and monitoring of menu and service performance to optimize profitability and enhance customer satisfaction.

E-Commerce
Customer data analysis (buying trends, user journey), optimization of marketing campaigns, management of projects related to digital transformation.

Craft
Tracking of overdue payments, inventory and supply management, analysis of sales performance to identify profitable services and adjust strategy.
Transport / Logistics
Route optimization, inventory management, real-time delivery tracking, and analysis of transport system performance.

Financial Services
Risk management, fraud detection, optimization of financial performance, and personalization of the customer offering.

Human Resources
Employee performance analysis, talent management, improving recruitment processes, and optimizing retention strategies.

Tourism
Analysis of visitor flows, measuring the impact of events, and adapting the tourism offering based on trends.

Media
Audience analysis, content optimization based on reader preferences, tracking article performance, and maximizing advertising revenue.

Retail
Analysis of customer purchasing behaviors, inventory optimization, offer personalization, and enhancement of the in-store or online customer experience.

SMEs / Startups
Optimization of internal processes, understanding of customer or financial data, support for strategic decision-making.

Events
Analysis of past event data (attendance rates, participant feedback, profitability), project management for event planning and execution, and optimization of logistics.
Case Study : Market trends analysis with the Ribbon chart
Move from a cluttered Excel sheet to a clear visual that reveals the evolution of products over time.

⚠️ Excel file intentionally blurred to protect data confidentiality
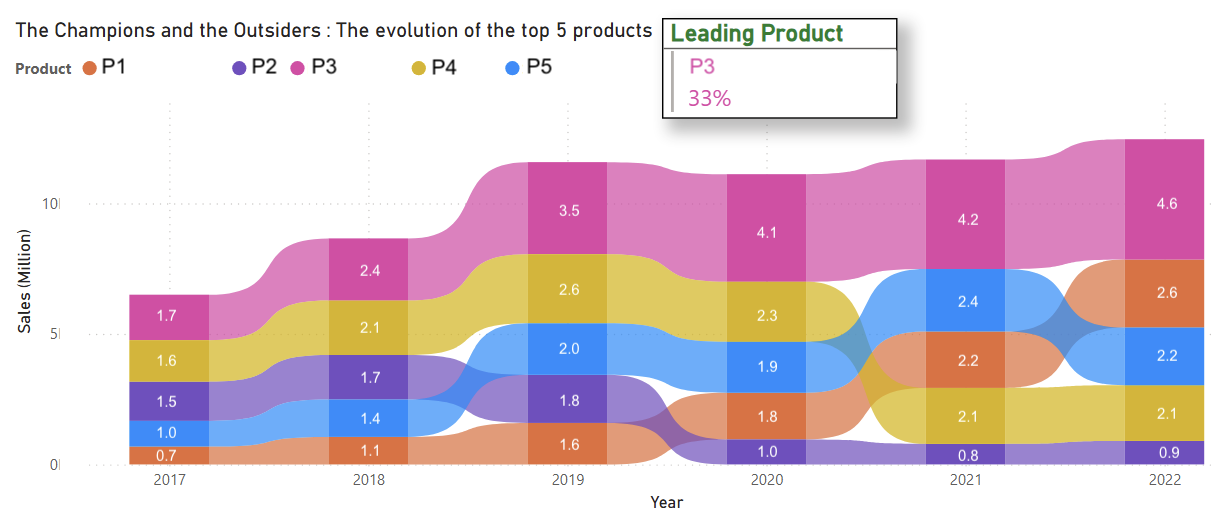
This simple and visual chart enables the company to quickly identify shifts in product positioning, spot strategic trends, and support decisions with accessible, easy-to-understand data.
The Ribbon Chart clearly illustrates market dynamics: Product 3 maintains its strong leadership, Product 4 steadily loses ground, while Product 1 — initially an outsider — gains significant traction.
Beyond the visual, analysis reveals the real story : P1 capitalized on the Covid period to align with emerging customer needs. In contrast, P4 failed to adapt and is now facing the consequences.
👉 This is where the role of the data analyst truly matters : turning a visual observation into a strategic diagnosis, and helping the business move from data to action.
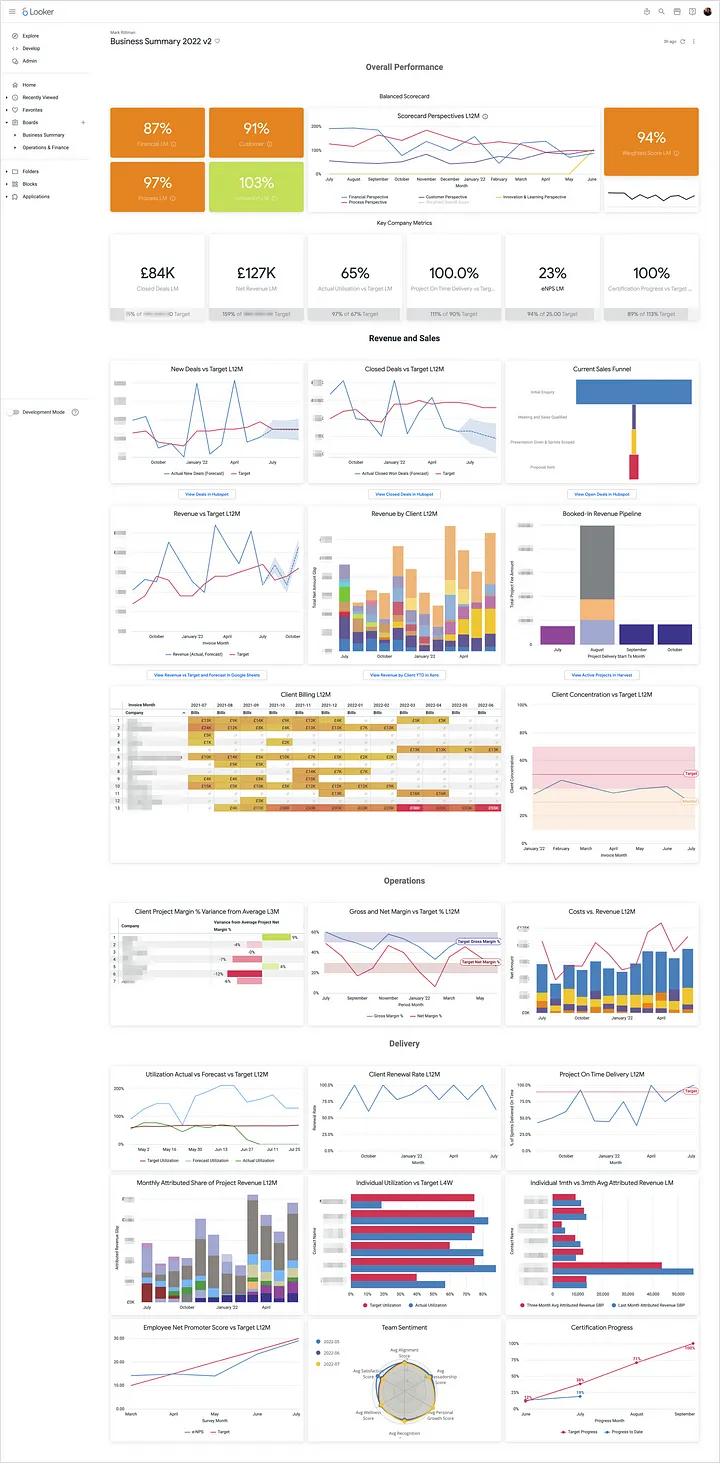
Case Study : Analyzing purchase behavior in retail
⚠️ The data presented has been anonymized and modified to ensure the confidentiality and protection of sensitive information.


What if your data became a real decision-making tool ?
I help you see things more clearly, better understand your business… and make decisions with confidence.
Tagline
With data analysis, you can :
Identify changes and anticipate risks
Combine intuition and concrete facts to make well-informed decisions
Improve efficiency and avoid wasting time or resources
Easily visualize key insights to communicate and act more effectively
Contact me

Powerful tools for impactful insights
With tools like Power BI or Looker Studio, your data becomes concrete, visual, and meaningful.
Tagline
What you can unlock with the right tools :
Build clear and interactive dashboards
Play with data to reveal trends
Automate reports to save time
Bring all your data into one place
Share insights easily with your teams
Contact me